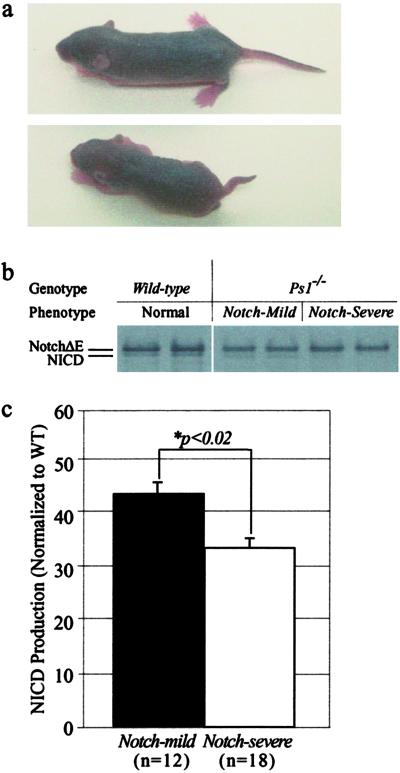
Fig 2.
Production of NICD by wild-type, PS1−/− Notch-mild and Notch-severe mice. (a) Six-day-old PS1−/− Notch-mild (Upper) and Notch-severe (Lower) mice showing reduced size and grossly deformed axial skeletons of the latter. (b) Cells from 6-day-old Notch-mild mice produced more NICD than cells from Notch-severe mice. (c) Comparison of relative NICD production (ratio of NICD/NICD+NotchΔE) from cells Notch-mild (n = 12) and Notch-severe (n = 18) mice shows a significant difference (P < 0.02) between the groups.

