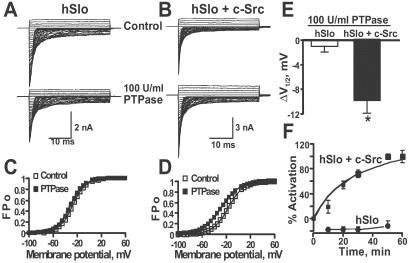
Fig 5.
PTPase partially reverses the inhibitory effect of c-Src on hSlo. (A) Inside-out recordings from the same cell expressing hSlo before (control) and after perfusion of 100 units/ml PTPase. (B) Currents from a cell coexpressing hSlo + c-Src before (control) and after perfusion of 100 units/ml PTPase. In A and B, traces are from −100 to +60 mV every 5 mV. The effect of buffer alone was tested before applying PTPase (control). (C and D) Corresponding FPo-V curves for hSlo and hSlo + c-Src, respectively. (E) Bar plot of mean ΔV induced by PTPase in hSlo and hSlo + c-Src. *, P < 0.002. (F) Time course of PTPase effect (n = 6–7, hSlo; n = 7–9, hSlo + c-Src).

