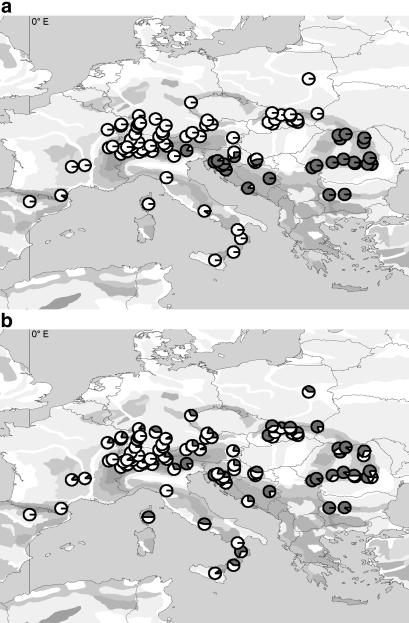
Fig 1.
Geographic maps of Europe showing all sampled A. alba populations. The circle sectors display the relative frequencies of the observed alleles of the respective marker. (a) Maternally inherited nad5-4 marker. White circle sectors mark allele 1 and dark sectors mark allele 2. (b) Paternally inherited psbC marker. Dark circle sectors mark allele A and white sectors mark allele B.

