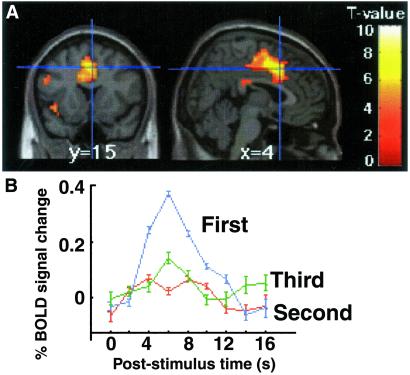
Fig 4.
(A) Location of the ACC region (BA 32, x,y,z = 4,15,42, Z = 4.8) displaying greater activity for the first task of a triplet relative to the second and third tasks averaged together. (B) Trial averaged time series data for the group at the peak of ACC cortex activation for the first, second, and third tasks of a triplet. Errors bars denote the SEM across participants.

