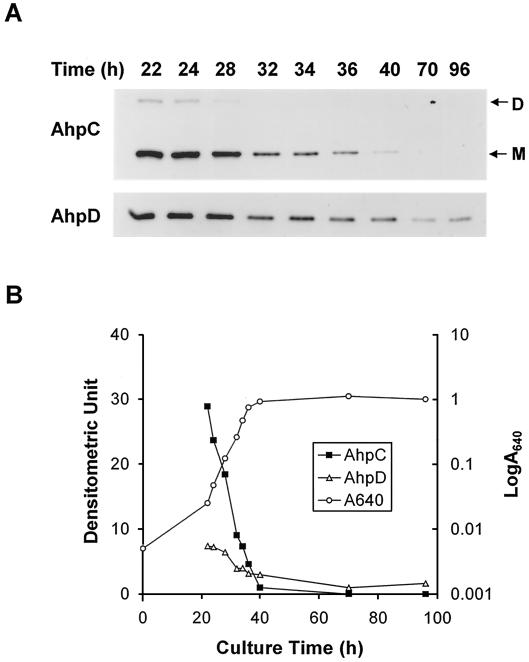
FIG. 3.
Growth-dependent expression of AhpC and AhpD proteins. M145 cells were grown in YEME. At various time points aliquots were taken for measurement of optical density at 640 nm and lysed to prepare cell extracts. (A) The AhpC and AhpD proteins were detected by Western blot analysis as described in Materials and Methods. The positions of the monomer (M) and dimer (D) of AhpC are shown. (B) The growth curve and the relative band intensity of the densitometric tracing data in panel A are presented. The densitometric value was set to 1 for AhpC at 40 h (closed square) and for AhpD at 70 h (open triangle).

