
FIG. 11.
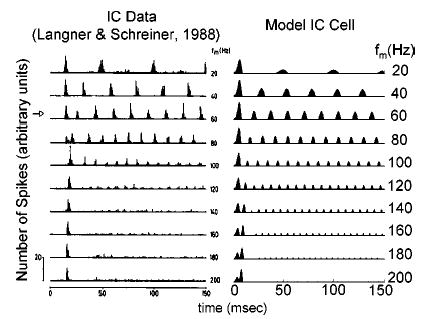
Comparison of actual (left) and model (right) IC cell PST histograms for a range of stimulus f m. Model parameters were the same as the cell illustrated in Fig. 10 (with SPL=20 dB). Physiological PSTs from Langner and Schreiner (1988, their Fig. 2, unit IC115; with permission).