
FIG. 2.
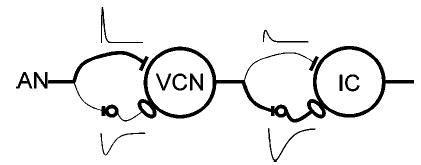
Schematic diagram of the same-frequency inhibition and excitation (SFIE) model. A single model AN fiber provides the postsynaptic cell with both excitatory and inhibitory input, via an inhibitory interneuron. The thickness of the lines corresponds to the relative strength of the inhibition and excitation at each level. Alpha functions representing the assumed membrane and synaptic properties are also shown.