
FIG. 3.
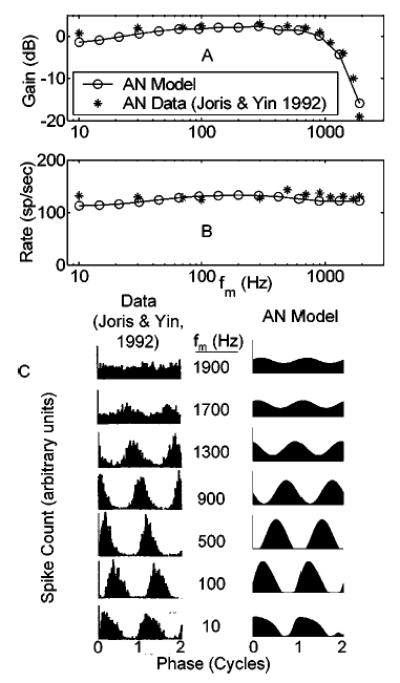
Comparison of model and actual modulation transfer functions and period histograms. (a) Physiological and model AN sync-MTFs for a high-CF fiber. (b) Rate-MTFs for the same fiber (onset response neglected). (c) Period histograms for the actual AN fiber (left column) and model AN fiber with matched parameters. Two cycles of the response are shown starting at a zero sine phase point of the modulating waveform. CF=21 kHz; SR=61 sp/s. Stimulus carrier frequency=CF; SPL set at ~20 dB above rate threshold. Cat data from Joris and Yin (1992, their Fig. 10; with permission).