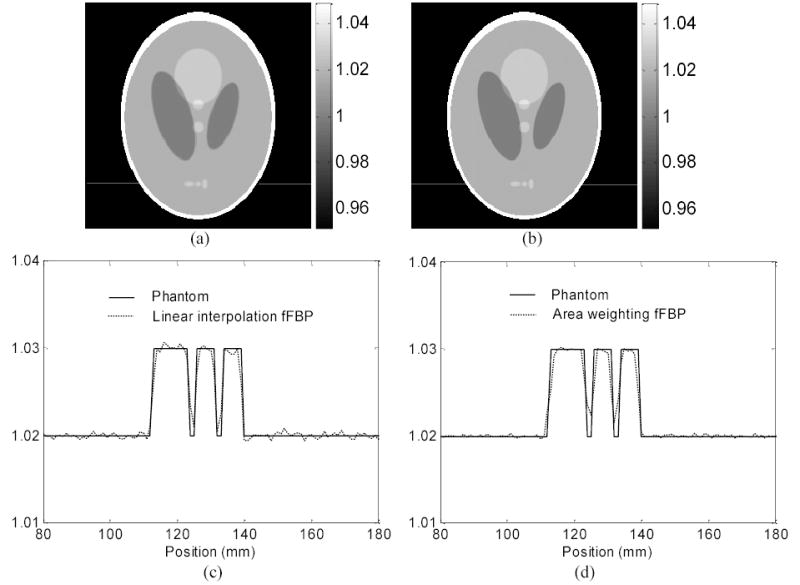
Fig. 3.

Picture (a) shows the fFBP reconstructed image of the Shepp-Logan head phantom by linear interpolation in the backprojection step. Picture (b) is the reconstructed image of the Shepp-Logan head phantom by area weighting in the backprojection step. Graphs (c) and (d) show the horizontal profiles though the reconstructed images at the indicated locations in (a) and (b) respectively. The solid line indicates the true phantom values; the dotted line is the result of the fFBP reconstructed images. Aliasing effect is seen, although at slightly different levels for these two interpolations, due to pixel discretization.
