Fig. 5.

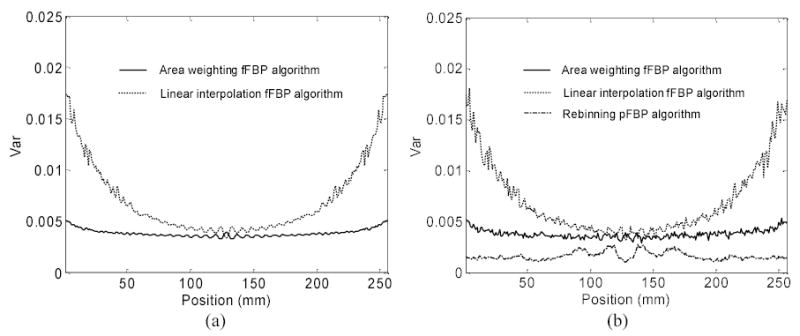
Horizontal profiles through the center of the variance images. Graph (a) shows the theoretically-predicted variance images. Graph (b) shows the empirically-determined variance images from 800 noisy realizations.

Horizontal profiles through the center of the variance images. Graph (a) shows the theoretically-predicted variance images. Graph (b) shows the empirically-determined variance images from 800 noisy realizations.