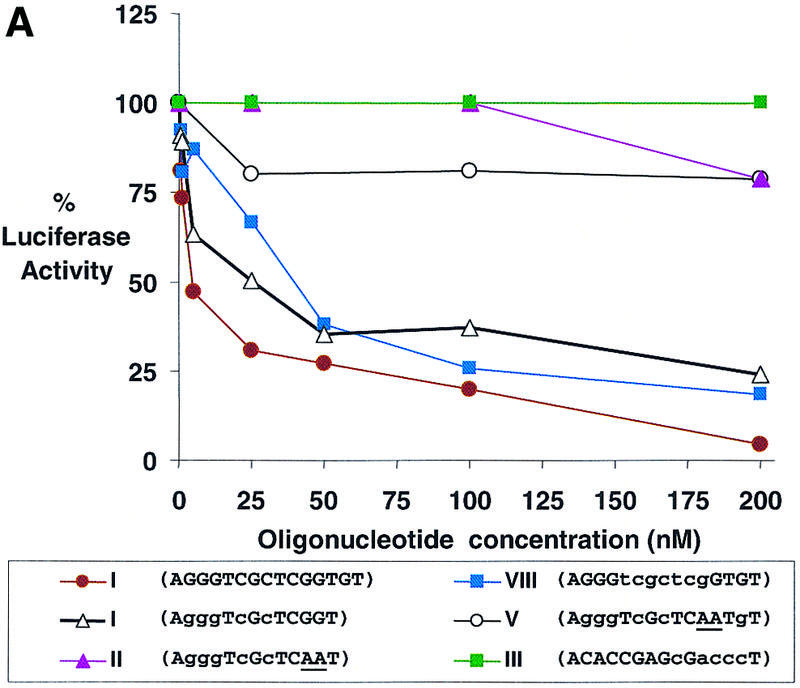
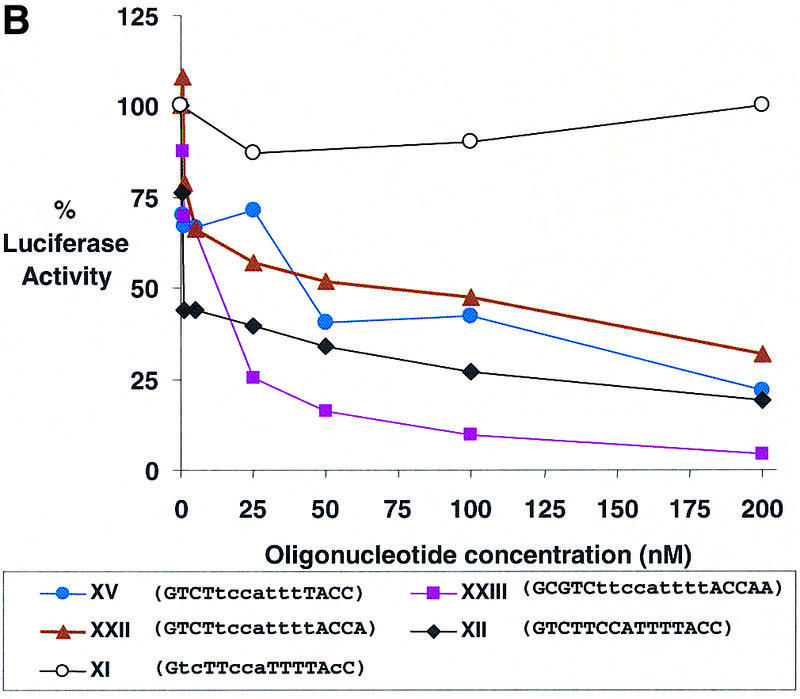
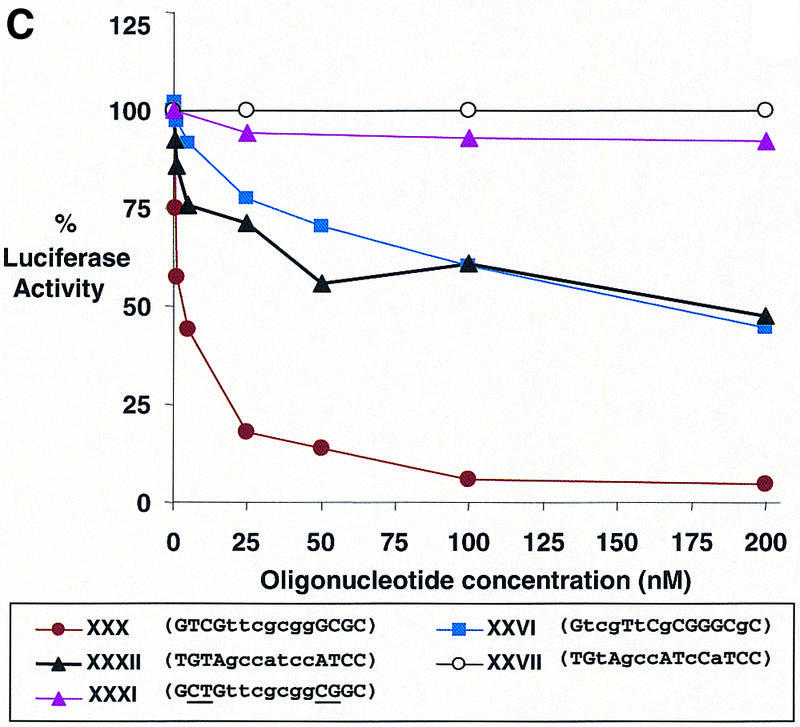
Figure 4.


Dose–response curves of antisense gene inhibition by LNAs and LNA–DNA chimeras targeted to (A) the 5′-UTR, (B) the translation start site and (C) the downstream coding region of luciferase mRNA. All points are averages of triplicate determinations and are normalized to an independent measurement of β-galactosidase activity. Capitalized letters within a sequence represent LNA, lower case letters represent DNA bases and underlined bases depict mismatched bases.
