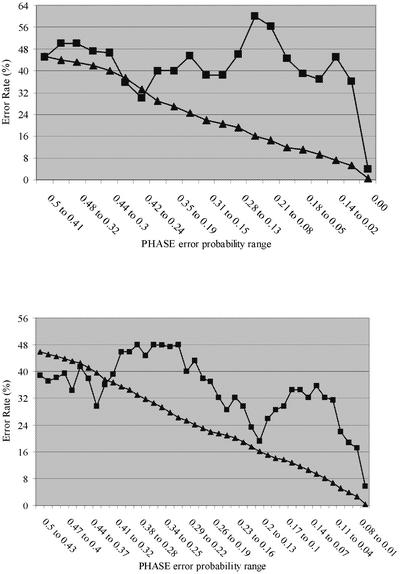
Figure 6.
Graph representation of observed versus expected errors calculated by the PHASE program. The expected errors are shown in triangles and the observed errors are shown in squares. (Top) Results for ApoE. (Bottom) Results for LPL. Most of the heterozygous genotypes are assigned with 0% error probability, representing 78% and 77% of the heterozygous genotypes in ApoE and LPL.

