Figure 1.
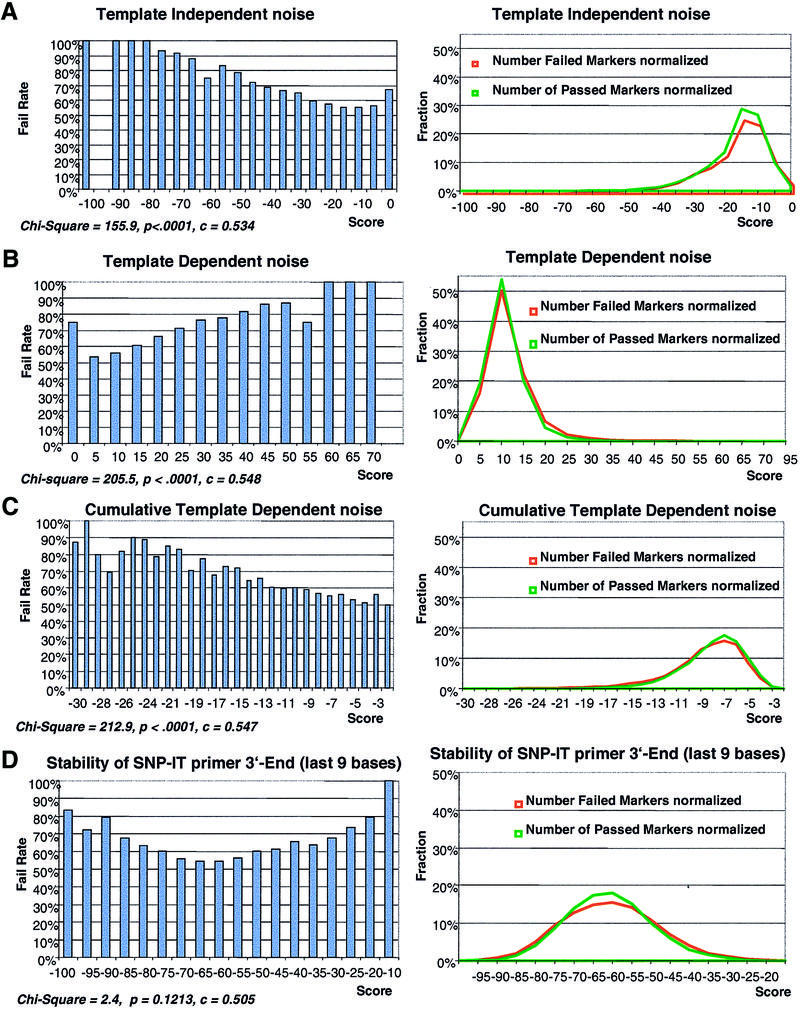
The correlation curve of the failure rate of the SNP-IT reaction with several primary scores (left) and distribution of failed and passed SNP markers against the same scores (right). The score values in the correlation curves (x-axis) and number of markers in the distribution curves (y-axis) are normalized for comparison. The normalization of scores is done by dividing all score values by the minimal (maximal) score. The distribution curves are normalized by plotting fraction of passed or failed markers instead of total number of markers. Distributions of passed markers are shown in green, distributions of failed markers are shown in red. (A) TIN score correlation and distribution curves. (B) Correlation and distribution curves of the ratio of TDN score to stability of the SNP-IT primer 3′-end. TDN is measured as the most stable structure formed between SNP-IT primer and PCR product. (C) Cumulative TDN: the same curves for TDN score measured as a sum of all possible dimers formed between SNP-IT primer and PCR product. (D) Correlation and distribution curves of the last nine 3′-end bases of the SNP-IT primer.

