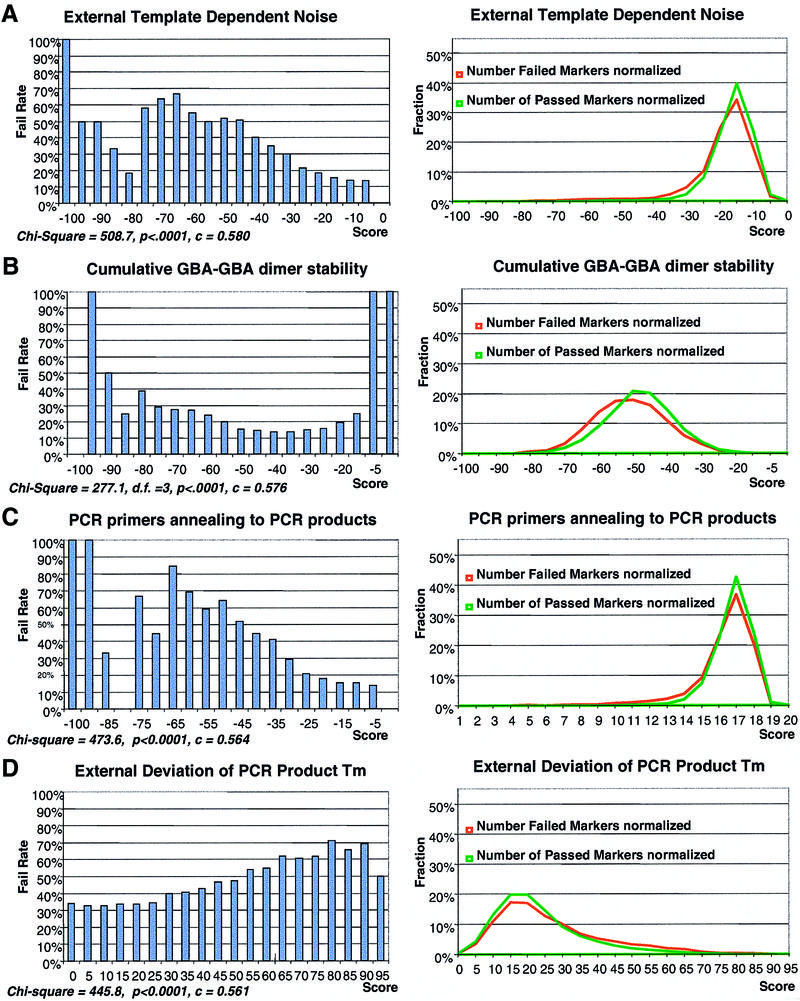
Figure 2.
The correlation curve of the failure rate of 12-plexed SNP-IT reactions with several primary scores that measure the ‘external’ noise caused by the interference of 11 SNP markers with the one considered for calculation (left). The distribution of failed and passed SNP markers against the same scores (right). The score values in the correlation curves (x-axis) and number of markers in the distribution curves (y-axis) are normalized for comparison. The normalization of scores is done by dividing all score values by the minimal (maximal) score. The distribution curves are normalized by plotting fraction of passed or failed markers instead of total number of markers. Distributions of passed markers are shown in green, distributions of failed markers are shown in red. (A) External TDN noise measured as the free energies sum of most stable structures formed between SNP-IT primer and 11 ‘external’ PCR products. (B) External TDN noise measured as a sum of all possible dimers formed between SNP-IT primer and 11 ‘external’ PCR products. (C) Correlation and distribution curves of the deviation of the SNP-IT primer melting temperature from the other 11 SNP-IT primers. (D) Correlation and distribution curves of the deviation of the GC content of PCR primers pair from the other 11 PCR primer pairs.

