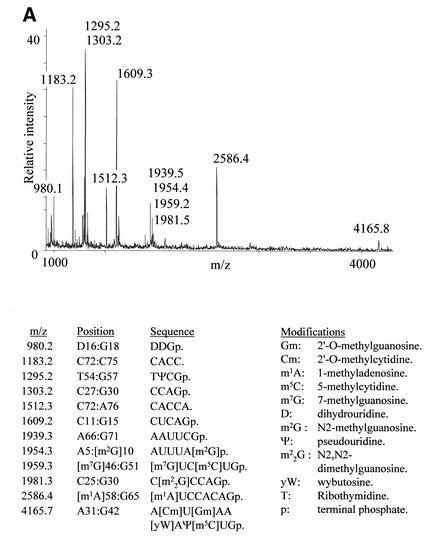
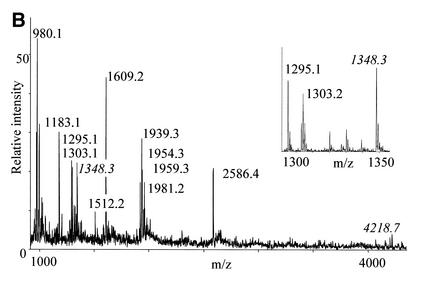
Figure 2.
MALDI-TOF mass spectra of yeast tRNAPhe digested with RNase T1 before (A) and after (B) reaction with acrylonitrile. Peaks labelled with italics contain ψs and have increased by 53.0 Da upon cyanoethylation. The insert is a zoom on the region containing the TΨCGp fragment. The table lists the expected RNase T1 fragments based on sequence and modification data present in the tRNA database (27).


