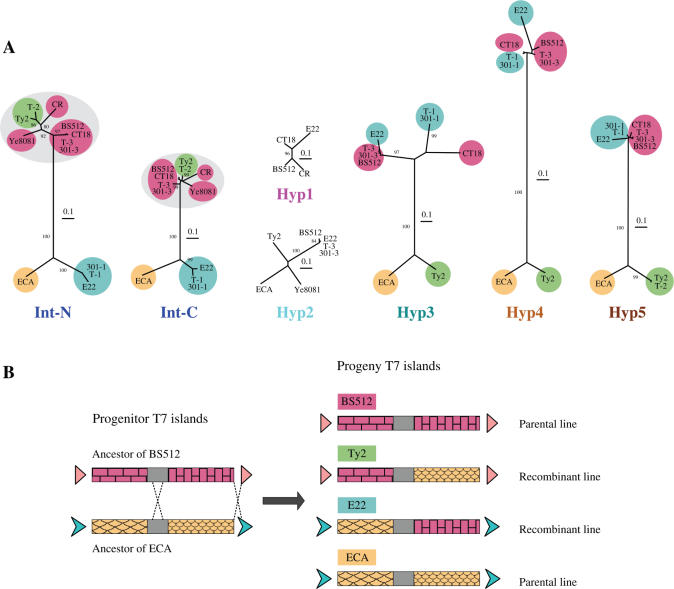
Figure 9.
Phylogenetic analysis of six protein homologs shared by at least four of the 12 T7 islands. (A) Neighbor-joining trees of the six homologous island proteins are presented from left to right in the same order as the genetic map. The integrases were split into N-terminal and C-terminal domains (Int-N and Int-C), as indicated in Supplementary Figure S2, and the trees were generated for both domains. The eight islands that are adjacent to a tRNA gene encode closely related integrases (both Int-N and Int-C, circled in grey), while the other four integrases (ECA, 301-1, T-1 and E22) are distantly related. Reassortment along the genetic map of distances between sets of islands, shown by colored ellipses, indicates a major recombination between ancestors of ECA (orange, only on the bottom of the trees) and BS512 (red, only on the top) to give recombinants of E22 (blue, switches from bottom to top) and Ty2 (green, switches from top to bottom). All trees were normalized to the same scale, which represents a distance of 0.1 (in the Jones-Taylor-Thornton (JTT) amino acid replacement model). The bootstrap values given are percentages of 1000 replications, and only values greater than 80% are shown. (B) One possible double recombination between two distantly related T7 islands.

