
Figure 3.
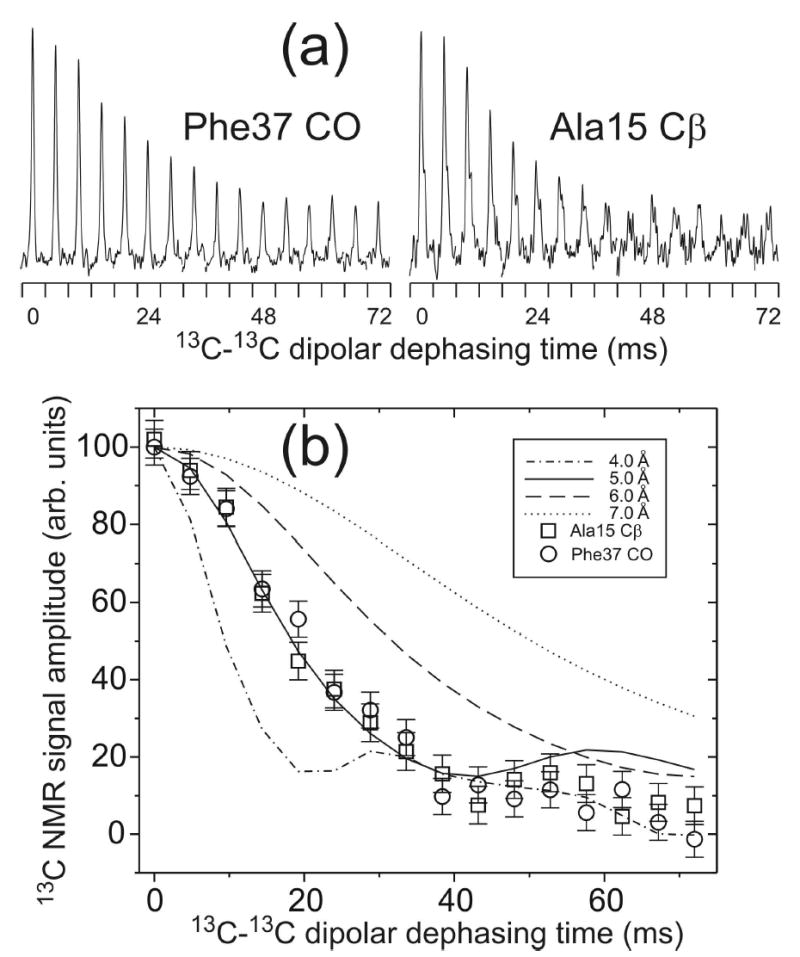
(a) Measurements of intermolecular 13C-13C dipole-dipole couplings in Ure2p10–39-AGF fibrils, using the fpRFDR-CT solid state NMR technique. Each Phe37 carbonyl or Ala15 β-carbon NMR peak is plotted in a 2.0 kHz spectral window. Peaks for dephasing times between 0 and 72 ms are concatenated to show the dipolar dephasing curves. (b) Comparison of experimental and simulated fpRFDR-CT curves, with intermolecular 13C-13C distances between 4.0 Å and 7.0 Å in the simulations. Error bars represent the root-mean-squared noise in the experimental spectra. Intermolecular distances are determined to be 5.0 ± 0.5 Å for both the Phe37 carbonyl and the Ala15 β-carbon, consistent with an in-register parallel β-sheet structure in the fibrils.