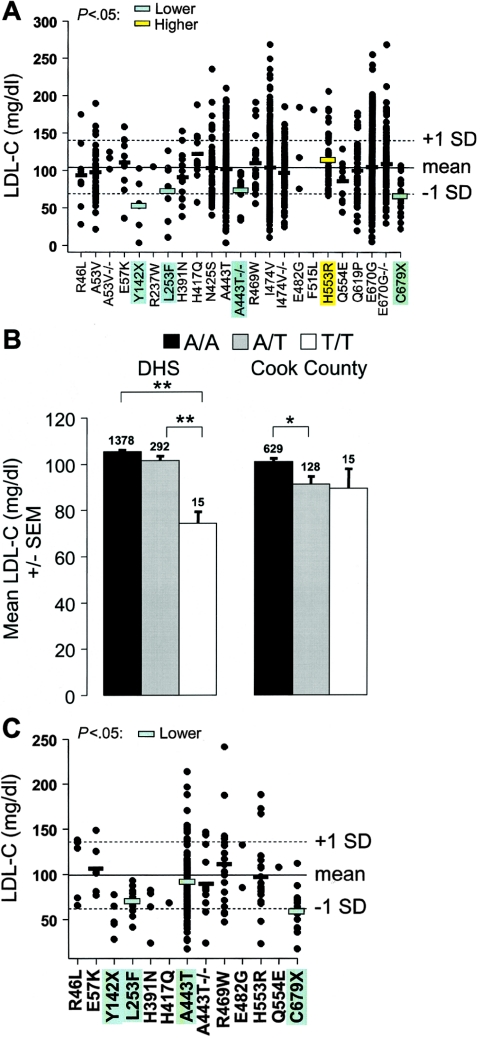
Figure 3.
Plasma LDL-C levels in blacks in the DHS (A) and Cook County (C) samples. The mean (solid lines) and SD (dashed lines) of plasma LDL-C levels adjusted for age and sex are shown. Horizontal bars, Mean plasma LDL-C levels for each sequence variant (omitted if n<6). Significantly lower or higher plasma LDL-C levels are indicated by green- or yellow-shaded bars, respectively. B, Mean (± SEM) of the plasma LDL-C level at the A443T variation in the DHS blacks (left set of bars) and Cook County subjects (right set of bars). The number of subjects in each group is given above the bars. *P<.05, **P<.01; by pairwise two-sided t tests with Holm correction for multiple comparisons.

