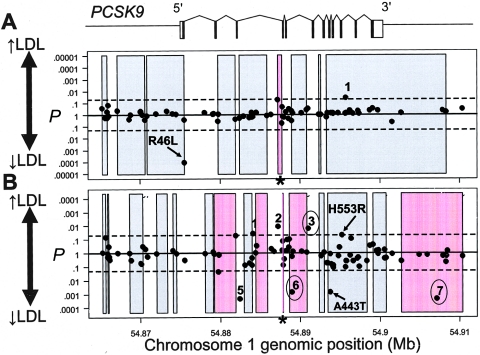
Figure 6.
Haplotype block structure across PCSK9 and P values for significance of association of common SNPs with plasma LDL-C level in whites (A) and blacks (B) in the DHS sample. SNPs and haplotype blocks are plotted along the X-axis according to genomic position. The P value for each SNP is plotted above or below the midline according to whether the mean plasma LDL-C level of the heterozygous genotype is higher (above midline) or lower (below midline) than the mean plasma LDL-C level of the homozygous common genotype. Coding SNPs significantly associated with plasma LDL-C level are indicated (arrows), and the corresponding amino acid sequence variations are given. Arabic numerals indicate the noncoding SNPs significantly associated with plasma LDL-C level in whites (1) or blacks (1–7). SNPs that were also significant in the Cook County sample are circled. The extents of haplotype blocks are indicated (shaded rectangles). Haplotype blocks significantly associated with plasma LDL-C level are shaded in pink. P values for haplotype blocks are based on the global statistic. Asterisks (*) indicate haplotype blocks that were significantly associated with plasma LDL-C level after exclusion of all SNPs that were individually associated with plasma LDL-C level. Dashed lines, P=.05. The genomic structure of PCSK9 is shown schematically above the plots. Genomic positions are based on National Center for Biotechnology Information (NCBI) build 34 of the human genome.

