
Figure 3.
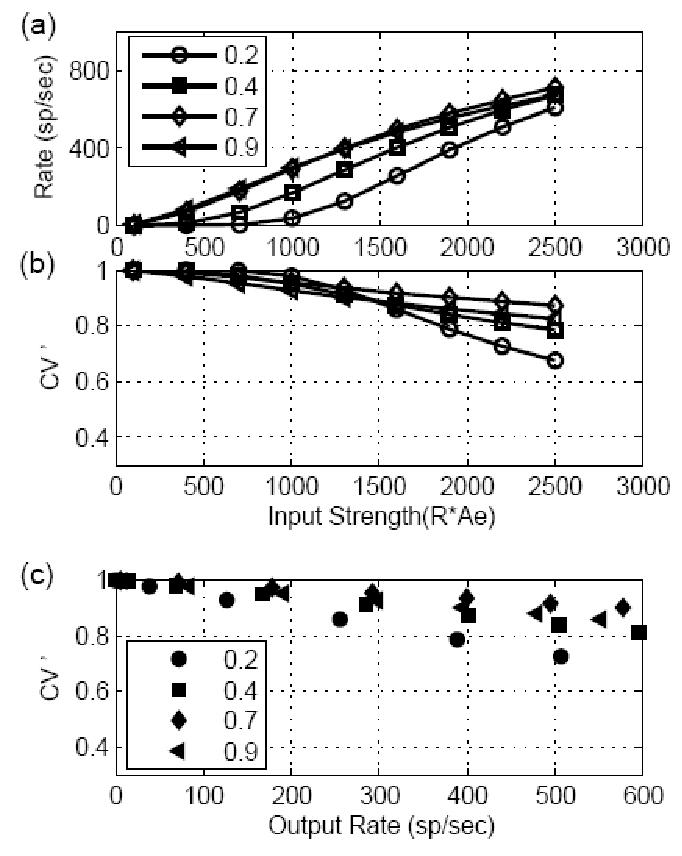
Responses of models receiving stationary inputs with different EPSP amplitudes and a fixed time constant (400 μs). Data are plotted in the same manner as in Fig. 2. (a) The input-output rate function was more linear for models with large EPSP amplitude and more nonlinear for models with small EPSP amplitude. (b) Regularity measure CV ’ of model responses. The change of model EPSP amplitude did not affect the CV ’ of the model responses; the CV ’ remained high, presumably because of the short EPSP time constant used in the computation. (c) CV ’ replotted as a function of model response rate. When model cells had same output rate, there was no clear monotonic relationship between CV ’ and the model EPSP amplitude.