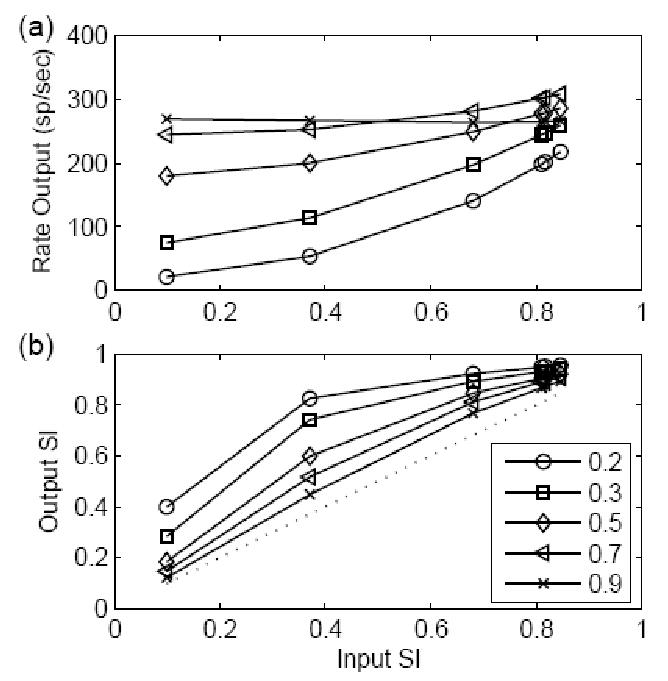
Figure 6.

Responses of models with different EPSP amplitudes and a fixed EPSP time constant of 400 μs to non-stationary inputs. The results are plotted in the same way as Fig. 4. The stimulus had a frequency of 500 Hz with fixed input strength of 800. Since the input strength was defined as the EPSP amplitude multiplied by the input rate, the input rate doubled when the model amplitude was decreased by half. In this way, the energy of the model inputs was kept constant for different input SIs. (a) Model rate responses. (b) The SI measure of the model responses. The EPSP amplitude had a larger effect on the degradation of the output SI when the input SI was high as compared to the effects of time constant illustrated in Fig. 4.
