
Figure 7.
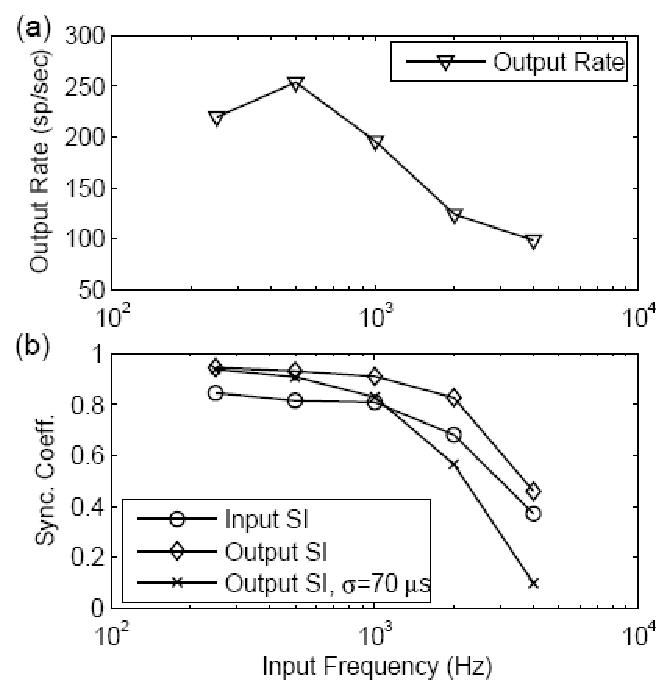
Responses as a function of stimulus frequency for a model with EPSP amplitude of 1/3 and a time constant of 400 μs. The input spike rate was fixed at 2400 spikes/sec, and the input SI varied with frequency systematically to fit the AN fiber data (Johnson 1980; Rothman and Manis, 2003a, plotted as circles in the bottom panel). (a) Model response rate changed non-monotonically as input frequency increased. (b) SI of the model output with and without time jitter added (crosses and diamonds, respectively). The time jitter had a normal distribution with a standard deviation of 70 μs; the calculation was based on the convolution of the output PST and this normal distribution.