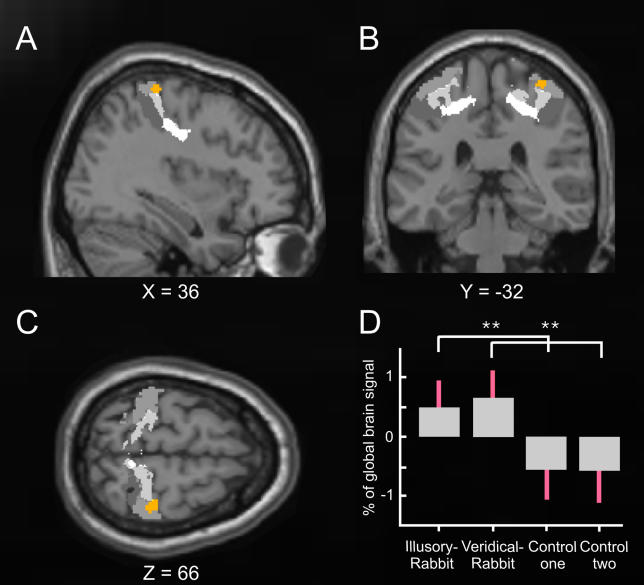
Figure 2. Common Activation for the Illusory-Rabbit and the Veridical-Rabbit versus Control Conditions Embedded in Probabilistic Cytoarchitectonical Maps of BAs 3a, 3b, 1, and 2.
Statistical T-maps (orange) obtained from the random-effects group analysis for the conjunction contrast of illusory-rabbit versus control data, and of veridical-rabbit versus the other (equivalent but independent) control dataset. The activation in right SI (peak at X = 36, Y = −32, Z = 66,p <0.005 for display purposes) is projected on the (A) sagittal, (B) coronal, and (C) transverse slices of the Montreal Neurological Institute standard brain, superimposed on gray-level-coded cytoarchitectonical probability maps (BA 3a in very light grey, BA 3b in light grey, BA 1 in grey, and BA 2 in deep grey), taken from Eickhoff et al. (2005). The plot (D) shows the parameter estimates for the experimental conditions (standard errors indicated in red), extracted from the peak of the activation (orange) in right SI. Note that both the veridical-rabbit and the illusory-rabbit conditions showed significantly higher activation than the two control datasets (seeMaterials and Methods for why the latter were split to allow conjunction analysis), which were equivalent, whereas the two rabbit conditions did not differ from each other.

