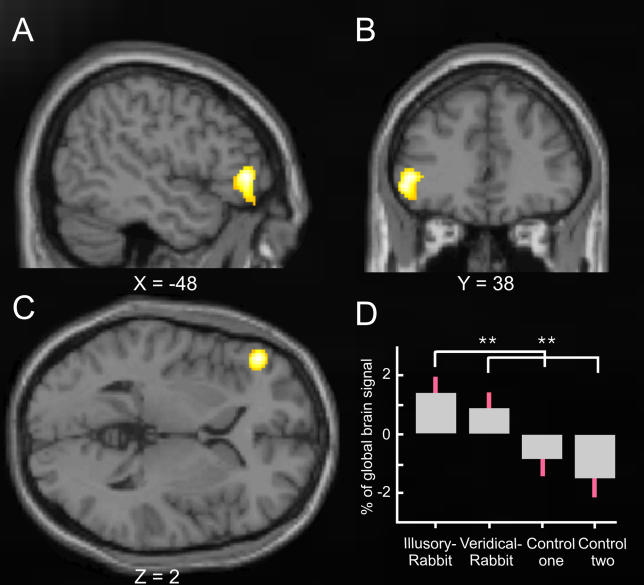
Figure 5. Common Activation for the Illusory-Rabbit and the Veridical-Rabbit versus Control Conditions beyond Somatosensory Cortex in the Whole-Brain Analysis.
Regions beyond the somatosensory cortex that displayed activity increases during both illusory- and veridical-rabbit, relative to control conditions (whole-brain, random-effects, group analysis). The graph shows the statistical T-map of the conjunction contrast of illusory-rabbit versus control data, and veridical-rabbit versus the other (equivalent but independent) control dataset (p < 0.001 for display). This revealed activation of the left inferior frontal gyrus (peak at X = −48, Y = 38, Z = 2). The format for the plot in (D) is as for the analogous plot inFigure 2D. Note that the veridical-rabbit and the illusory-rabbit conditions showed significantly higher activation than the two control datasets, which were equivalent, whereas the two rabbit conditions did not differ from each other.

