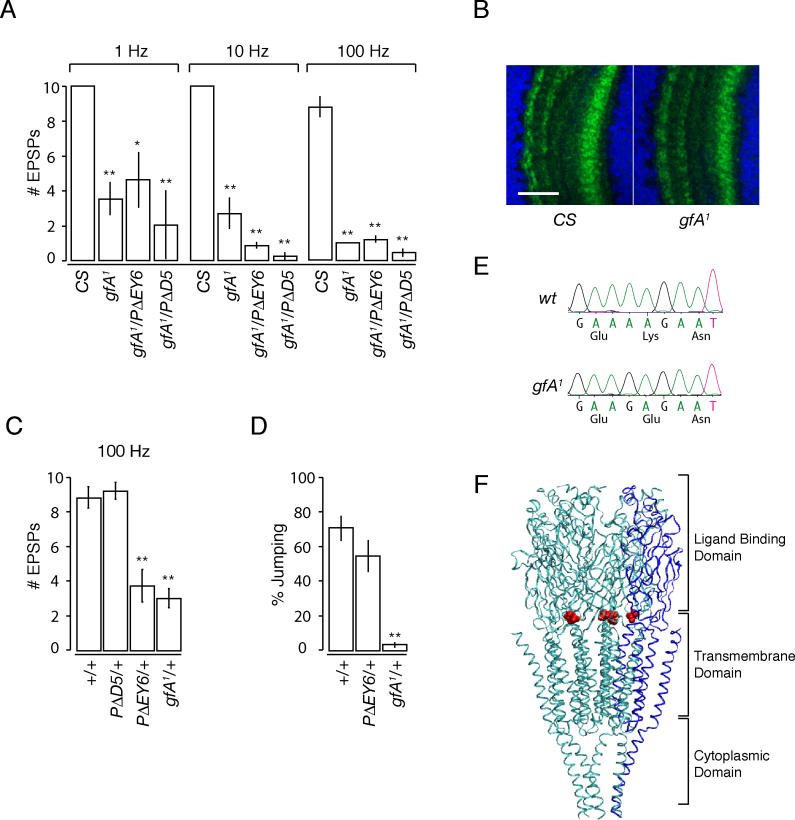
Figure 4. gfA1 is a Mutant Allele ofDα7 .
(A) The response of transheterozygous animals to giant fiber stimulation at 1, 10, and 100 Hz is shown as a histogram using Canton-S (CS) flies as controls.p-Values (1 Hz):CS (n = 6);gfA1, 0.004 (n = 6);gfA1/PΔD5, 0.0009 (n = 4);gfA1/PΔEY6, 0.02 (n = 5).p-Values for 10 Hz and 100 Hz were 2.8 × 10⁻⁵ for all mutant genotypes.
(B)gfA1 flies do not show loss of Dα7 protein. Representative staining in the medulla ofCS andgfA1 flies is shown. Control and mutant flies were processed together for immunohistochemistry. Scale bar: 20 μm.
(C)gfA1 andPΔEY6 show dominant phenotype at the PSI-DLM synapse. Comparison of the response to 100 Hz giant fiber stimulation ofPΔD5, PΔEY6, andgfA1 in transheterozygous combinations withCS flies as controls is shown as a histogram.p-Values:CS (n = 6),PΔD5/+, 0.99 (n = 6);PΔEY6/+, 0.0002 (n = 7);gfA1/+, 0.0001 (n = 5).
(D)gfA1 flies are dominant in jump behavior. Comparison of jump behavior inbw; st, PΔEY6/+; bw; st, andgfA1/+; bw; st is shown in a histogram.gfA1/+; bw; st flies fail to jump whilebw; st andPΔEY6/+; bw; st show no significant difference.p-Values:bw; st (n = 10),PΔEY6/+; bw; st (n = 10), 0.23,gfA1 /+; bw; st, (n = 10), 0.00001.
(E) Electropherogram showing basepair change that results in amino acid substitution ingfA1 mutant relative to theCS (wt) sequence.
(F) Location of mutated residue ingfA1 (shown in red) indicated on the structure of the nAChR fromTorpedo marmorata [35]. This protein consists of five subunits, one of which is depicted in blue, while the others are in cyan. The residue is drawn in van der Waals representation to emphasize its position. This figure was generated using VMD [56].

