
Fig. 2. Hysteresis and bistability in single cell transcription profiles.
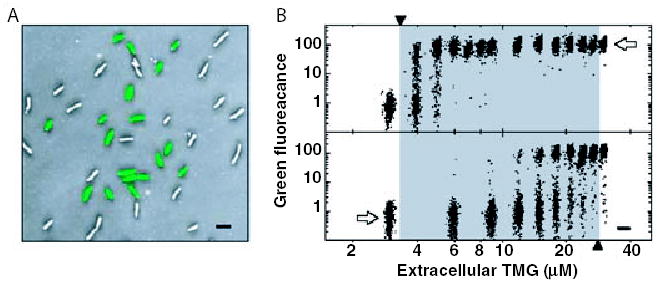
A. Overlayed green fluorescence and inverted phase-contrast images of cells that are initially un-induced for lac expression, then grown for 20 h in 18 μM thio-methylgalactoside (TMG), a non-metabolizable lactose analogue. The cells show a bimodal distribution of lac expression, with induced cells having over one hundred times the green fluorescence of uninduced cells.
B. A series of cell populations, initially un-induced (lower panel) or fully induced (upper panel) for lac expression, were grown 20 h in media containing various amounts of TMG. Scatter plots show log (green fluorescence) for about 1000 cells in each population. Each scatter plot is centred at a point indicating the underlying TMG concentration (Ozbudak et al., 2004). Figure reproduced with permission from the Nature Publishing Group.