FIG.2.

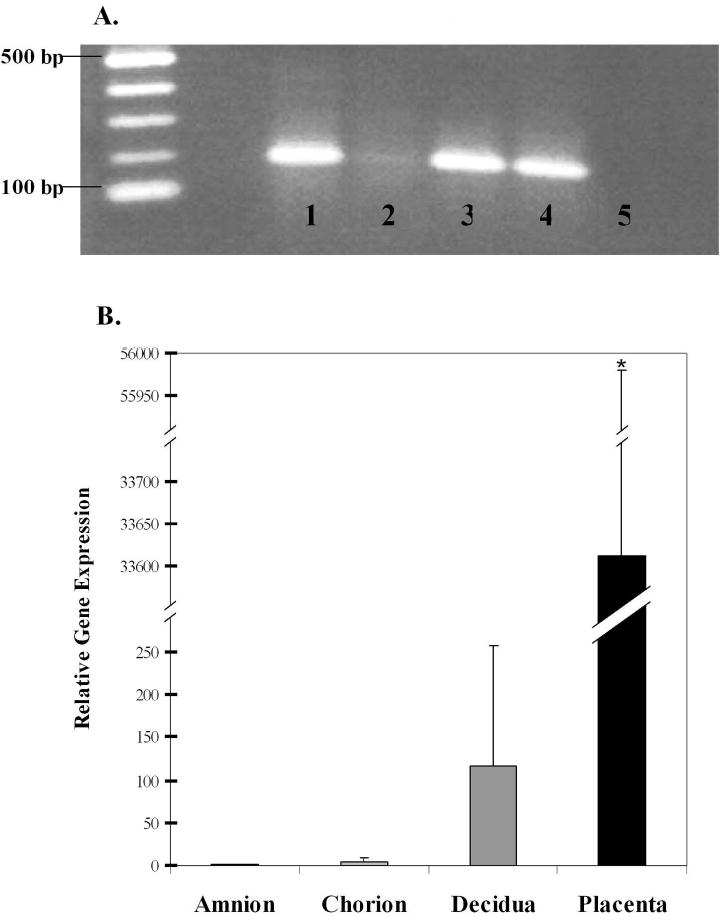
INSL4 gene expression by RT-PCR, shown in (A) as a single band of 192bp in cell lines and tissues. Lane 1: amniotic epithelial-like WISH cells, Lane 2: full thickness fetal membrane, Lane 3: placental trophoblast, Lane 4: choriocarcinoma JAR cells, Lane 5: negative control. (B) INSL4 expression in tissues by quantitative real-time PCR, shown as gene expression relative to the amnion. Tissues were all collected at term before labor, placenta (n=5), amnion, chorion and decidua (n=4). Means ± SD, asterisk indicates significantly more INSL4 expressed (p<0.05) in the placenta compared to the amnion, chorion or decidua.
