
Fig. 4. Microarray analysis.
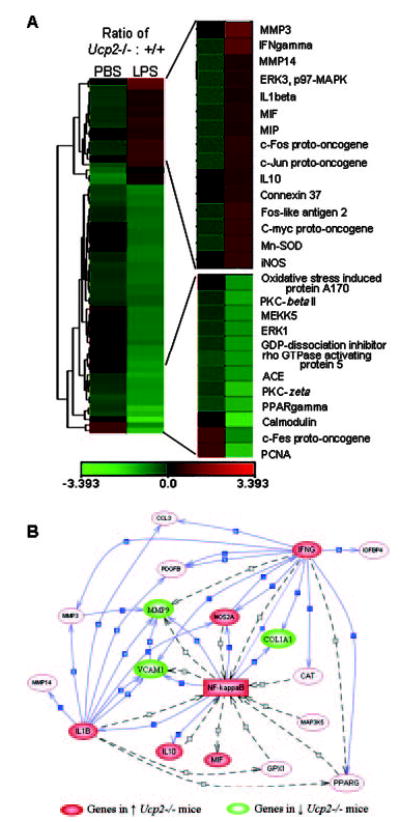
A, a clustering algorithm was used to group the LPS treatment and genes in spleen tissue. Left-hand columns show the ratio of fold change in gene expression from Ucp2−/− versus Ucp2+/+ following PBS treatment (basal condition). Right-hand columns present the ratio of the differences between the genotype (Ucp2−/− versus Ucp2+/+) for the fold change in gene expression between LPS and PBS basal conditions. Green and red rectangles represent repressed and induced values for individual genes, respectively. Genes that are altered significantly between genotypes or by LPS treatment are presented in the figure. The scale at the bottom is expressed as log2 of the relative ratios. B, network analysis of microarray data built up by PathwayAssist™. In this figure, the solid arrows denote regulated expression. The dashed arrows indicate unspecified regulation.