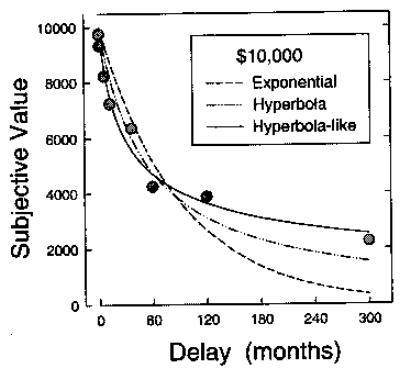
Figure 6.

The subjective value of a delayed $10,000 reward plotted as a function of the time until its receipt. The curved lines represent alternative forms of the temporal discounting function (Equations 1,2, and 3) fit to the data. Data are from “Discounting of Delayed Rewards: A Life-Span Comparison,” by L. Green, A. F. Fry, and J. Myerson, 1994, Psychological Science, 5, p. 35. Copyright 1994 by Blackwell Publishers, Limited. Reprinted with permission.
