
Figure 11.
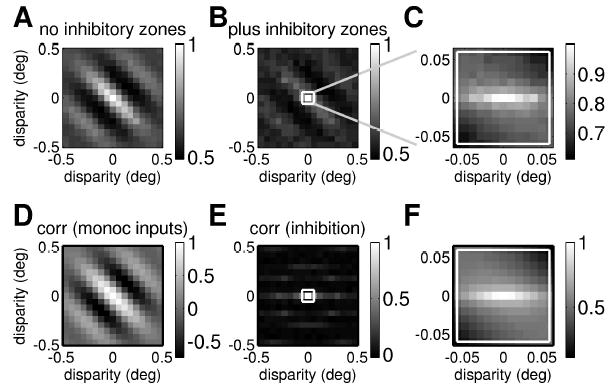
Monocular suppression by horizontally oriented inhibitory regions can result in a horizontally elongated disparity tuning surface. (Top row) Disparity tuning surface with and without monocular suppression. (A) Disparity tuning surface for a single binocular subunit without any suppression from inhibitory zones, as sketched in Figure 2 (equation 2.7, with the threshold set at zero so that Θ represents half-wave rectification). (B, C) Disparity tuning surface for the same binocular subunit after incorporating monocular suppression from inhibitory zones prior to binocular combination, as sketched in Figure 3 (see equation 2.10; again Θ represents half-wave rectification). At large scales (B), some trace of the original oblique structure remains, but in the central region where sensitivity to disparity is strongest (shown expanded in C), the structure is horizontal. (Bottom row) Correlation between left and right eye inputs as a function of disparity. (D) Correlation between output of classical receptive fields in left and right eyes (see equation 2.6). (E) Correlation between total inhibition from end zones in left and right eyes (see equation 2.11). (F) Correlation between output of classical receptive fields after inhibition from end zones.