
Figure 4.
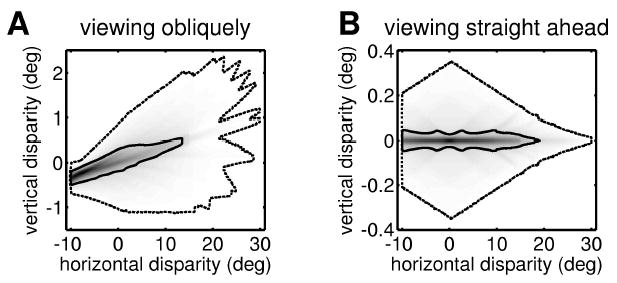
The probability distribution of horizontal and vertical disparities for a vergence angle of 10 degrees. (A) Helmholtz elevation V = 15 degrees, mean Helmholtz azimuth Hc = 15 degrees. (B) Helmholtz elevation V = 0 degree, mean Helmholtz azimuth Hc = 0 degree. In each case, the outer dotted contour marks the limit of possible disparities (beyond this contour, the probability density is zero). In A, this contour is only approximate: its irregularities reflect the relatively small number of retinal positions investigated. The solid contour marks the median (50% of randomly chosen possible correspondences lie within this iso-probability contour). In A, the SD of the isotropic gaussian used for smoothing was 0.04 degree; in B, it was 0.01 degree. The width of the distribution’s central ridge is limited by this smoothing.