
Figure 6.
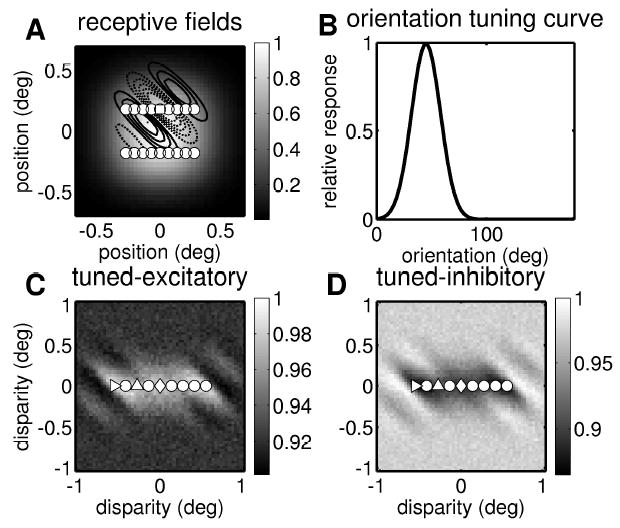
Response properties for a multiple subunit complex cell. (A) Monocular receptive field envelope. The gray scale shows the sum of the gaussian envelopes for all 18 receptive fields in one eye. The dots indicate the center of the receptive fields. The square is the center of the receptive field shown in Figure 2 (marked here with contour lines; solid lines show ON regions and broken lines OFF regions). (B) Orientation tuning curve. This shows the mean response of the complex cell to drifting grating stimuli at the optimal spatial frequency, as a function of the grating’s orientation. The preferred orientation is 45 degrees, reflecting the structure of the individual receptive fields. (C) Disparity tuning surface. This shows the mean response of the complex cell to random dot stereograms as a function of two-dimensional disparity. The disparity tuning surface is clearly elongated along the horizontal axis. The responses have been normalized to one, as indicated with the scale bar. The superimposed dots show the position disparities of the individual binocular subunits; the 18 subunits have 9 different disparities. The circuitry for three subunits is sketched in Figure 7; the position disparity for the three subunits shown there is here indicated with matching symbols. In the top subunit in Figure 7, the receptive fields in the two eyes are identical; this subunit therefore has zero position disparity (the diamond at (0,0)). The middle subunit in Figure 7 has receptive fields at different positions in each retina. It therefore has a horizontal position disparity, marked with a triangle pointing up. The bottom subunit in Figure 7 has an even larger horizontal position disparity, marked with a triangle pointing right. The tuned-excitatory disparity tuning surface shown here is the sum of 18 disparity tuning surfaces like that in Figure 2, but offset from one another horizontally. Thus, although the individual tuning surfaces were elongated along an oblique axis, the resulting disparity tuning surface is elongated horizontally. (D) Disparity tuning surface for a tuned-inhibitory complex cell. This was obtained with exactly the same receptive fields and subunits as in C, except that now, one out of each pair of monocular subunits made an inhibitory synapse onto the binocular subunit (see equation 2.8).