
Figure 3.
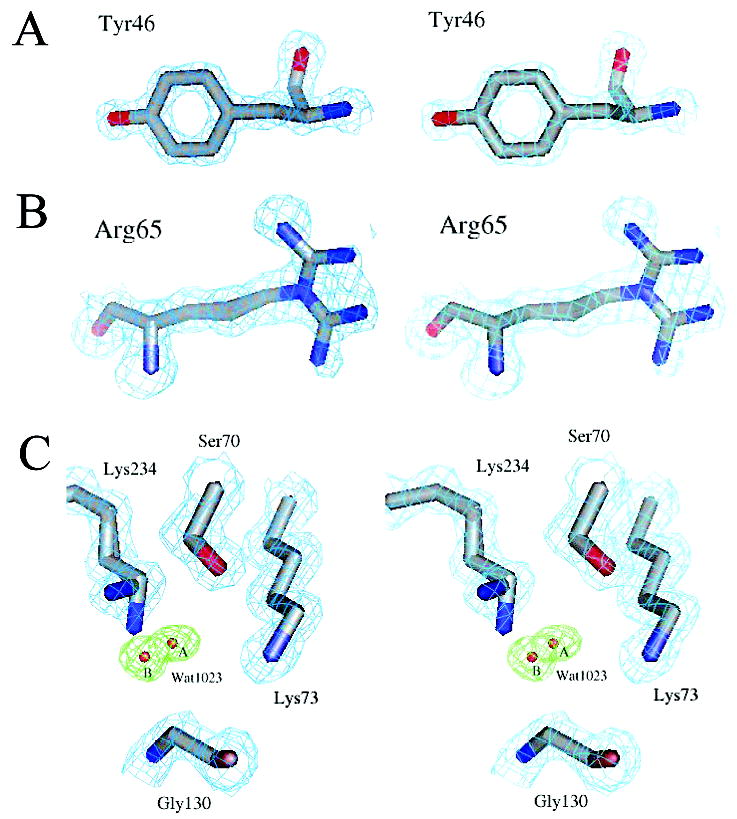
Electron density of the characteristic regions of the S130G structure. Carbon, nitrogen, and oxygen atoms are colored gray, blue, and red, respectively. (A–C) Quality of the S130G β-lactamase mutant crystal structure at 1.40 Å resolution. (A) Stereoview of the Tyr46 structure and 2Fo – Fc electron density contoured at 2σ (cyan). (B) Stereoview of the alternative conformations modeled for Arg65 superimposed on the 2Fo – Fc electron density map (cyan) at 1σ. (C) Electron density for the S130G active site. The final 2Fo – Fc map (cyan) contoured at 1.5σ is overlaid with simulated annealing omit electron density at 4.0σ (green) for the new active site water (Wat1023A/Wat1023B).