Figure 4.

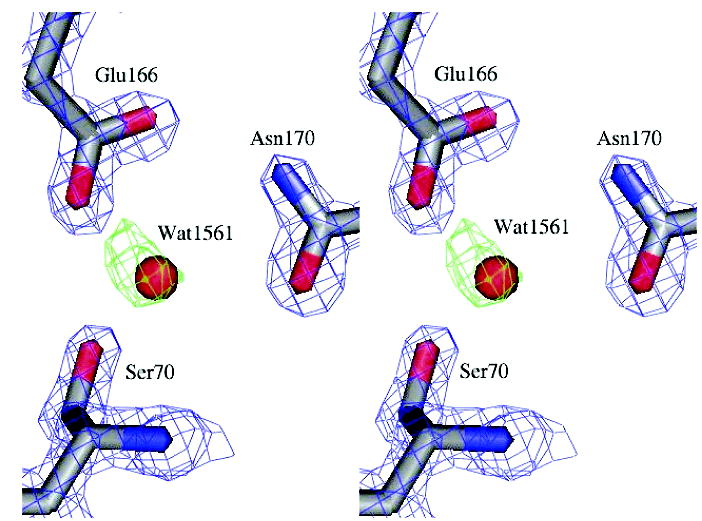
Electron density for the S130G catalytic water. The final 2Fo – Fc map (blue) at 2σ for the enzyme side chains is overlaid with the Fo – Fc electron density map (green, 3σ) prior to modeling the catalytic water.

Electron density for the S130G catalytic water. The final 2Fo – Fc map (blue) at 2σ for the enzyme side chains is overlaid with the Fo – Fc electron density map (green, 3σ) prior to modeling the catalytic water.