
Figure 2.
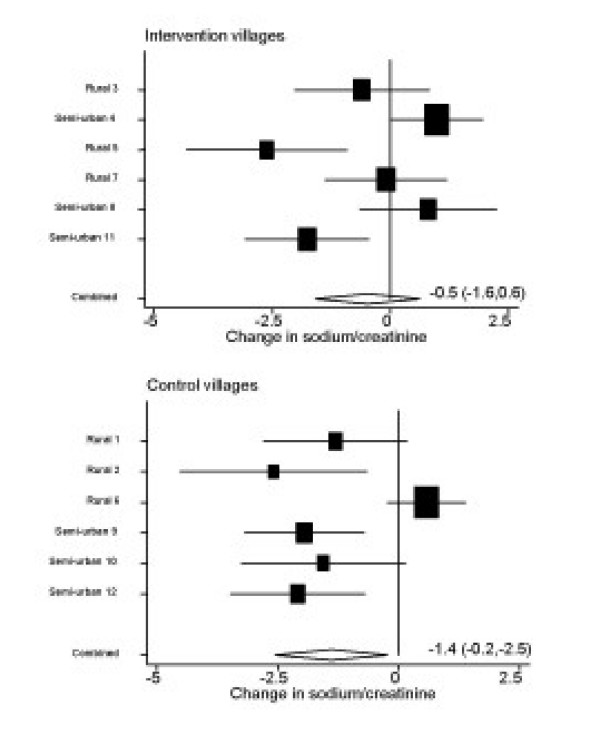
Changes in sodium-to-creatinine ratio adjusted for age, sex, BMI at baseline and locality (rural or semi-urban) in each village for the intervention and control groups of villages.
Official websites use .gov
A
.gov website belongs to an official
government organization in the United States.
Secure .gov websites use HTTPS
A lock (
) or https:// means you've safely
connected to the .gov website. Share sensitive
information only on official, secure websites.
Changes in sodium-to-creatinine ratio adjusted for age, sex, BMI at baseline and locality (rural or semi-urban) in each village for the intervention and control groups of villages.