
Figure 2.
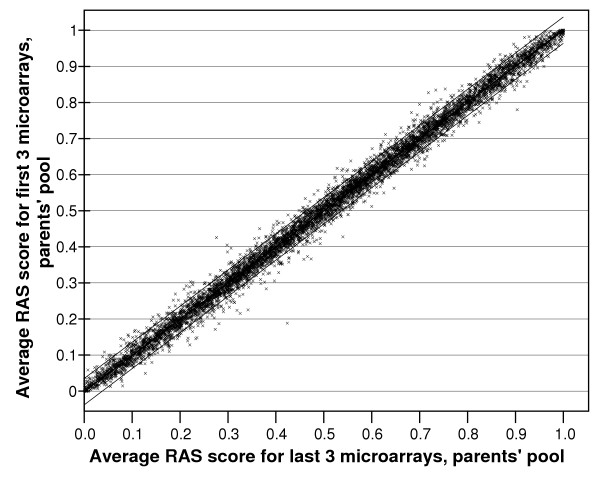
Averaged RAS values from sense and antisense strands obtained from 3 microarrays, compared with the data of the same pool of DNA from an independent set of 3 microarrays. The lines capture 95% of the data points. The correlation coefficient is r = 0.996.