
Figure 3.
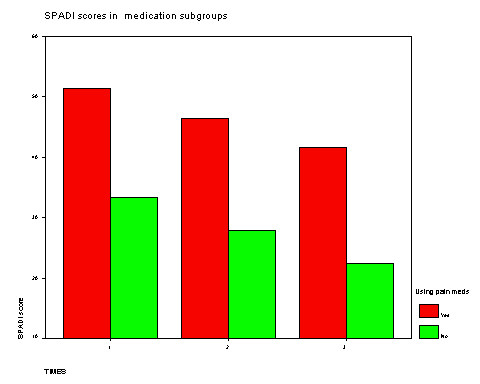
SPADI scores over time according to pain medication subgroups. This graph shows the SPADI score in patients that had were using pain medication (at baseline evaluation) as compared to those who were not. Significant improvements in SPADI scores occurred across time in both groups. Patients that were using pain medication had higher pain and disability at all 3 time-points (p < 0.001).