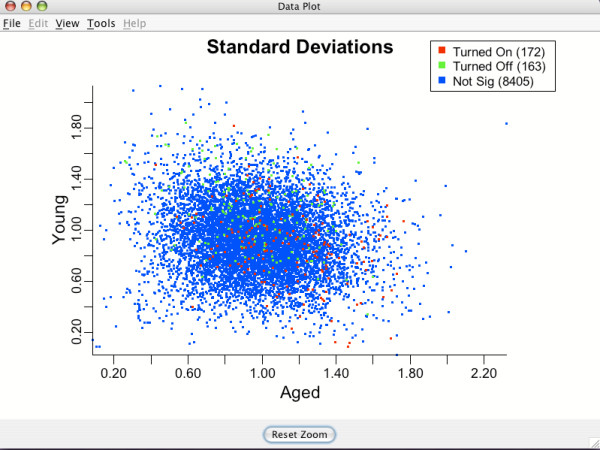
Figure 8.
Standard deviations for genes. Standard deviations for each gene after the clustering transformation for brain tissue data. Used to assess the equal variance assumption. Green points indicate genes which are being turned off for Aged compared to Young. Red indicates genes being turned on for Aged compared to Young. Blue points are genes that are not differentially expressing.

