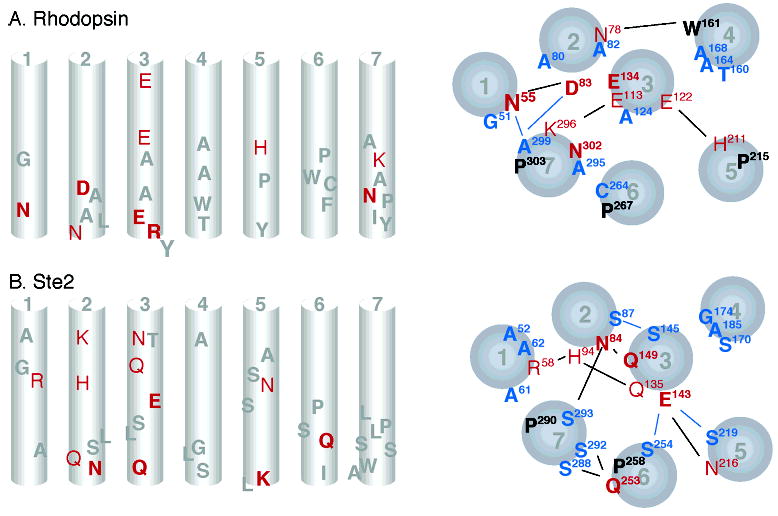
Figure 6.

Schematic representations comparing the location of conserved and polar residues in rhodopsin (A) and the Ste2 receptor (B). The left-hand panels show a side view of the TM helices (in the plane of the membrane) with conserved residues in gray, strongly polar residues in red, and conserved strongly polar residues in bold red. The right-hand panels show the TM helices as viewed from the intracellular side. Conserved residues are shown in black, group-conserved small and weakly polar residues in blue, strongly polar residues in red, and conserved strongly polar residues in bold red. Lines indicate potential interhelical interactions.
