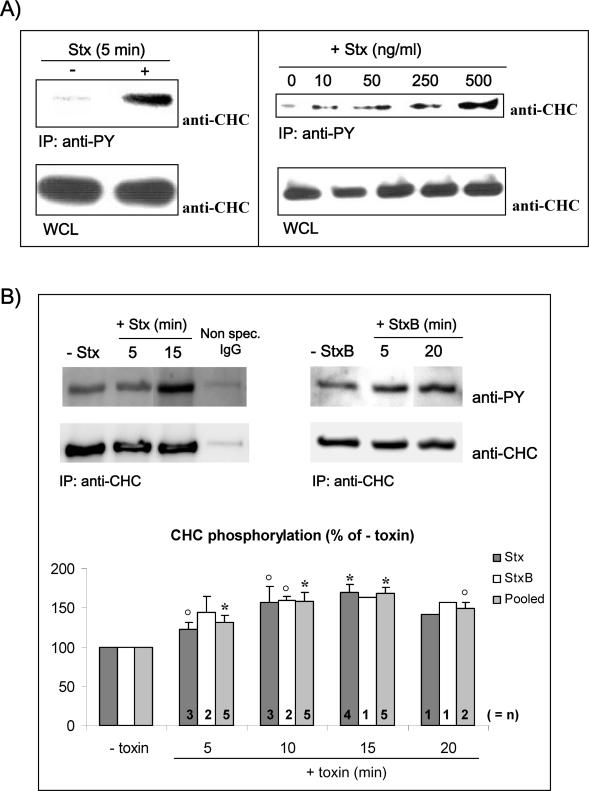
Figure 1.
Tyrosine phosphorylation of clathrin in response to Stx. (A) HeLa cells were incubated with or without Stx (250 ng/ml) for 5 min (left) or with increasing concentrations of Stx for 5 min at 37°C (right). The cells were then lysed, and tyrosine phosphorylated proteins were immunoprecipitated by using the slurry of an anti-PY column. The column elution was analyzed by immunoblotting with mouse anti-CHC. As a control, a fraction of the WCL was run in parallel, and CHC was detected. (B) HeLa cells treated with or without Stx or StxB (250 ng/ml) for the indicated time points were lysed and immunoprecipitated with mouse anti-CHC antibody (X22). As a negative control, cells were also immunoprecipitated with nonspecific mouse IgG. The immunoprecipitates were analyzed by immunoblotting with mouse anti-PY. To check equal loading, the membrane was then stripped and reprobed with anti-CHC. Note that all lanes shown for Stx are from the same blot, and all lanes shown for StxB are from the same blot. Graph, quantification of the amount of phosphorylated CHC (after normalization for the amount of immunoprecipitated CHC) after Stx and StxB treatment, and after pooling these results. The error bars show the SEM (n > 2) or the deviation (n = 2) for the different time points. Significant differences (p < 0.05) where determined by Student's t test and are indicated by a star; 0.05 < p <0.114 are indicated by open circles (○). Together, these p values indicate that the increase in CHC phosphorylation is significant.

