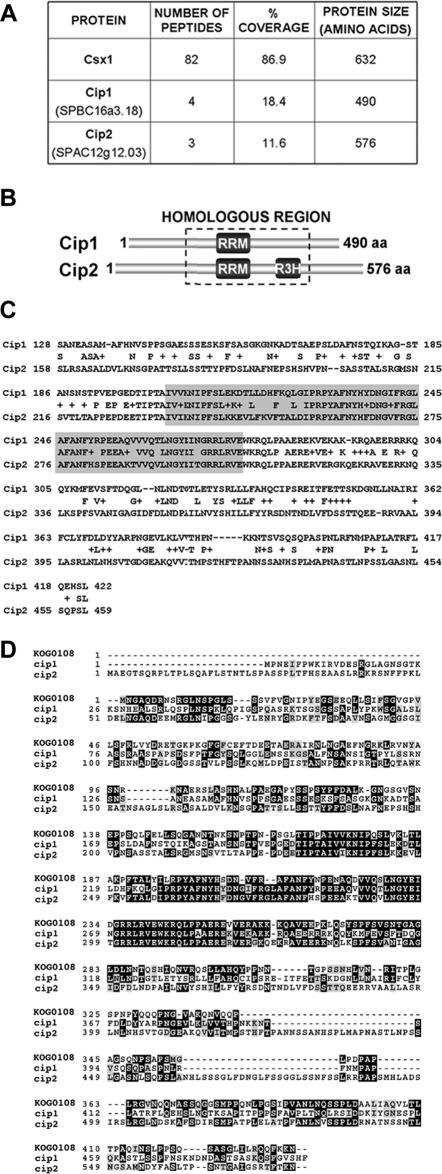
Figure 1.
Identification of Cip1 and Cip2. (A) Number of independent peptides and percent of primary sequence coverage obtained by mass spectrometry for each of the indicated proteins. The TAP purification was performed after treating the cells for 15 min with 1 mM H2O2. (B) RNA-binding domain distribution in Cip1 (SPBC16A3.18) and Cip2 (SPAC12G12.03). The region with the highest sequence identity between the two proteins is boxed. (C) Alignment of the homologous regions of Cip1 and Cip2. Shaded residues represent the RRM. The percentage of homology is 58%, with 41% of the amino acid residues being identical in both proteins. (D) Sequence comparison between Cip1 and Cip2 and the eukaryotic KOG0108 domain, corresponding to the mRNA cleavage and polyadenylation factor I complex, subunit 15. Each COG includes proteins that are inferred to be orthologues and represents an ancient conserved domain.

