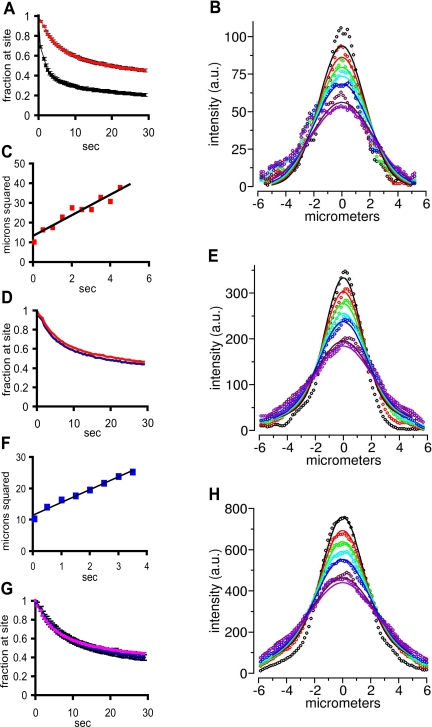
Figure 5.
Characterization of signal movement away from photoactivation site. (A) Probe was uncaged in speckles in cells containing either oligo(dT) (red curve) or oligo(dA) (black curve) and the average signal/pixel remaining at the uncaging site (bleach adjusted) was calculated for each time point and plotted. The bar on each time point represents the SE of the mean. (B) The Gaussian distributions of the signal intensity across a line across the nucleus and through the center of the uncaging site were digitally recorded at successive times after photoactivation (broken curves, top to bottom, 65, 450, 900, 1350, 1800, 3150, and 3500 ms), and a global algorithm was used to determine the best fit diffusion coefficient for the curves and time simultaneously (see Figure 6; see Materials and Methods). A representative distribution and the simulated fit (smooth lines) for an uncaging on a speckle is shown here; the diffusion coefficient estimated from this uncaging was 0.346 μm2/s. (C) The mean square displacement (at e–2) versus time plotted for the same uncaging site as shown in B. The line through the points is based on a linear least squares regression analysis (R2 = 0.92) and predicts a diffusion coefficient of 0.7 μm2/s. (D) Average signal remaining at uncaging sites over time after uncaging on (red curve) or off (blue curve) a speckle in cells containing oligo(dT). Error bars for each point have been omitted so that the two curves can be seen clearly. For each point the SE of the mean was less than or equal to ±3%. (E) Same as in B except the uncaging site was nucleoplasmic (off a speckle). The diffusion coefficient calculated from this global fit is 0.285 μm2/s. (F) The mean square displacement (at e–2) versus time plotted for the same uncaging site as shown in E. (D = 0.6 μm2/s; R2 = 0.98). (G) Average fraction of signal remaining at uncaging site after photoactivation of caged-fl oligo(dT) in speckles at 37°C (pink) and 22°C (blue). The bar on each point is the SE of the mean. (H) Same as B except at 22°C. The diffusion coefficient estimated from this global fit is 0.351 μm2/s.

