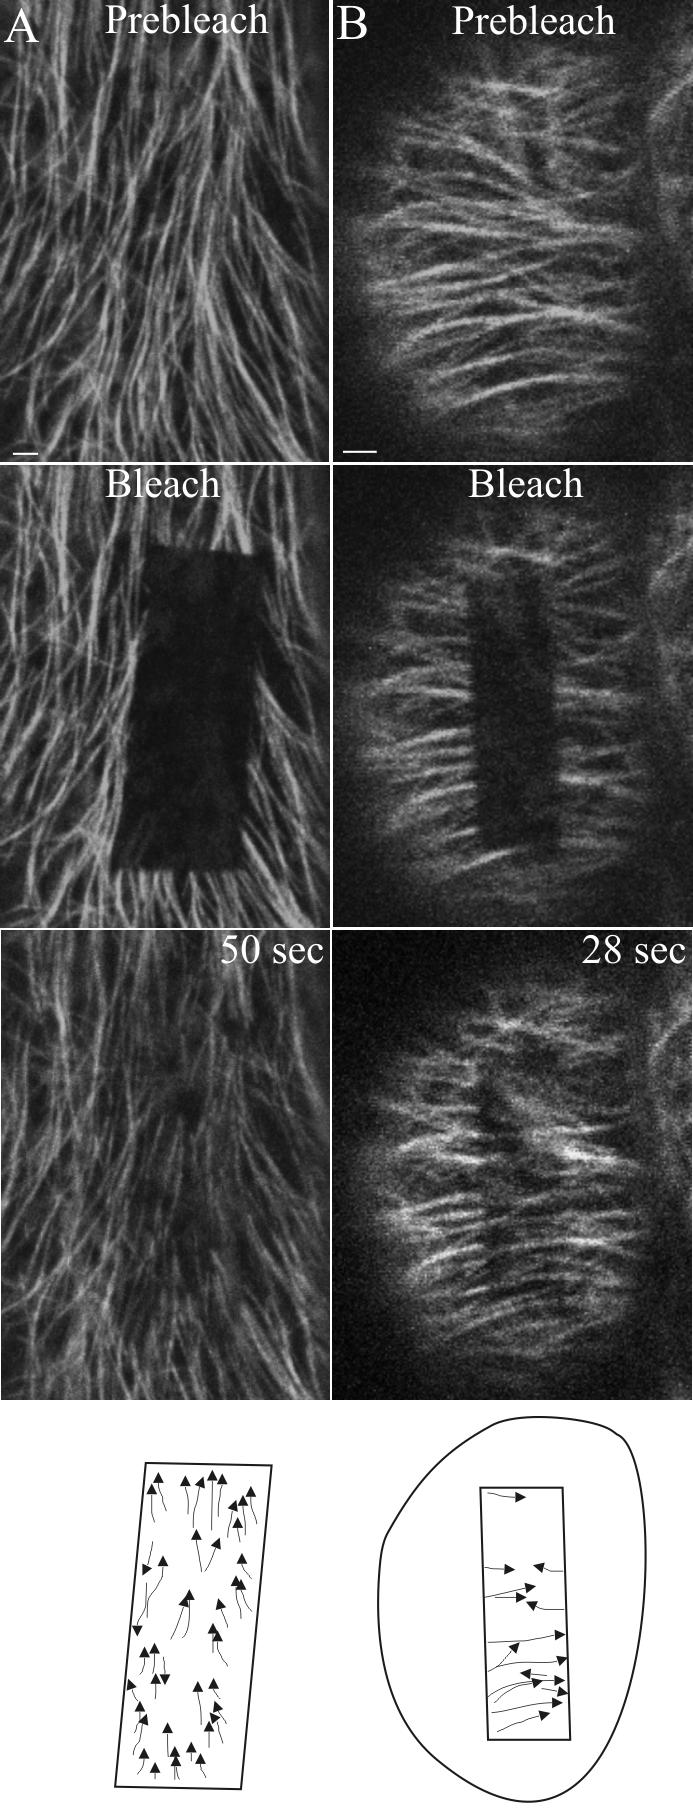
Figure 4.

FRAP analysis of MT (+)-end orientation in ordered arrays. Arabidopsis plants expressing GFP-TUB6 were used to determine the orientation of cortical MT (+)-ends in longitudinal (A) and transverse (B) arrays using confocal laser scanning microscopy. GFP fluorescence was bleached using three scans at 100% 488-nm laser power and fluorescence recovery monitored by collecting images at 3-s intervals using 3% laser power. The polarity of the cortical MTs in the last image is represented diagrammatically in the last panel. The fluorescence recovery pattern shows 90% directionality bias in A and 80% directionality bias in B. This is best viewed in the Supplementary Movies. Scale bar, 2 μm.
