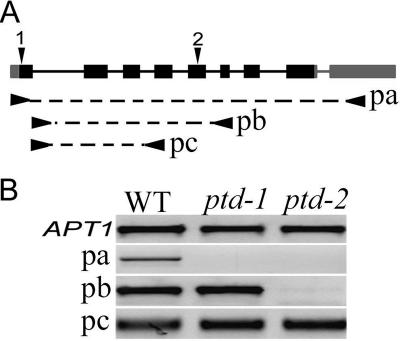
Figure 2.
The PTD gene structure and mRNA expression in the wild type and the two mutants. (A) A diagram showing PTD (At1g12790) locus with the exon/intron organization of PTD. Solid boxes indicate exons, including full coding (black) and untranslated regions (gray). The position of the T-DNA insertion sites of the ptd-1 and ptd-2 alleles are indicated by black arrowhead 1 and 2. Underneath the structure, arrow-dash bars-arrows indicate the approximate positions of different primers used for RT-PCR: pa, oMC1996/oMC1998; pb, oMC1735/oMC1736; and pc, oMC1735/oMC1887. (B) Results for RT-PCR with primer pairs of pa, pb, and pc. The APT1 control is indicated.

