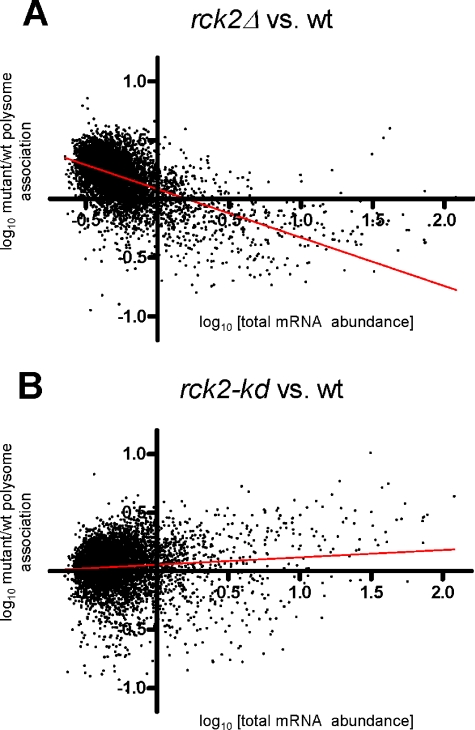
Figure 7.
Correlation between polysomal association and expression level is altered in rck2 mutants. Scatter diagram of array data from unstressed cells. Relative PAF value (PAFmutant/PAFwild-type) on y-axis; total mRNA abundance in wild-type cells on x-axis. Note logarithmic scale on both x- and y-axes. Linear regression trend line is shown in each diagram. Regression data for rck2Δ versus wild type: slope = –0.41 ± 0.008, r = –0.55, ***p < 0.0001; for rck2-kd versus wild type: slope = –0.06 ± 0.008, r = 0.09, ***p < 0.0001.

