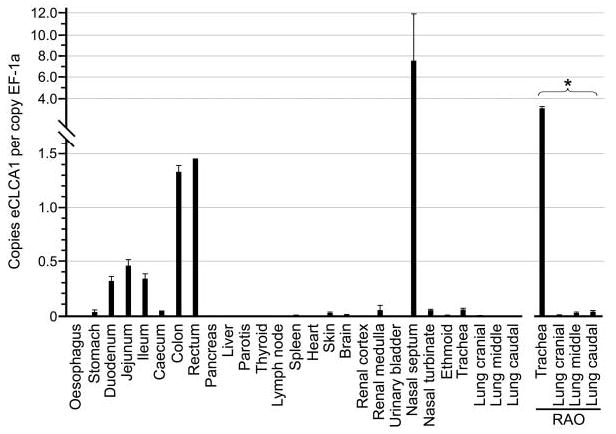
Figure 8.

Quantitative mRNA expression analysis by real time RT-PCR of eCLCA1 in normal equine tissues and tissues from the equine respiratory tract with recurrent airway obstruction (RAO). Only a subset of all tissues investigated is shown (see text). Expression levels are given as copy numbers of eCLCA1 per copy number of the housekeeping gene elongation factor-1a (EF-1a). Columns represent mean values plus standard deviations. Asterisk indicates statistically significant difference between normal and RAO lung tissue (p<0.05).
