


Figure 2.
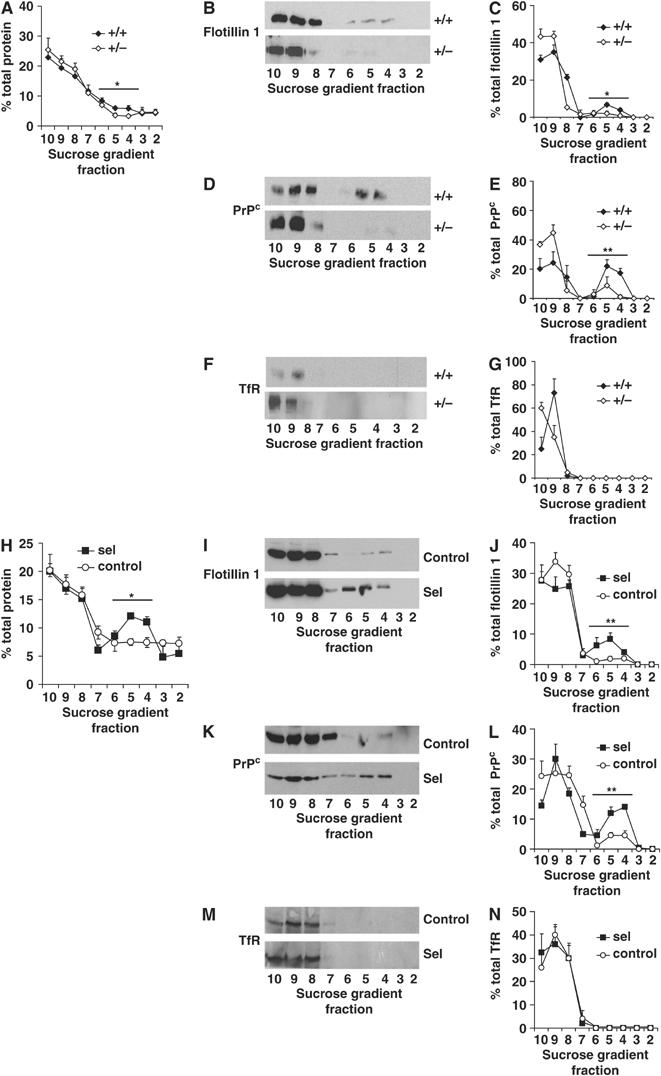
Seladin-1 modulates DRM protein composition. Homogenates from wild-type (+/+) and seladin-1 heterozygous (+/−) mouse brains and from control and seladin-1-overexpressing SH-SY5Y cells were extracted and centrifuged in a sucrose gradient. Fractions were collected and numbered from the lightest to the heaviest (2 to 10). The amount of protein in each gradient fraction is expressed as a percentage of the total protein along the gradient (A, H). Representative Western blots of the gradient fractions using antibodies against the DRM marker proteins flotillin 1 (B, I) and PrPc (D, K), and the non-DRM protein TfR (F, M) are shown. Graphs on the right show the distribution of flotillin 1 (C, J), PrPc (E, L) and TfR (G, N) in each fraction as a percentage of the total amount of the respective proteins along the entire gradient. Seladin-1 deficiency in mouse brains led to a significant decrease of the protein amount in fractions 4–6 corresponding to DRMs (A) and resulted in significantly lower amounts of DRM markers in these fractions (B–E), whereas the distribution of TfR did not differ between wild-type (+/+) and heterozygous (+/−) mouse brains (F, G). In contrast, overexpression of seladin-1 in SH-SY5Y cells led to an increased amount of protein in fractions 4–6 compared to control cells (H) and to significantly higher levels of the DRM markers flotillin 1 (I, J) and PrPc (K, L), whereas the distribution of the non-DRM protein TfR remained unchanged (M, N). The graphs show the average and standard error from three different mouse brains for each condition and from three independent seladin-1-overexpressing and control SH-SY5Y cultures. Asterisks show statistical significance of the difference in the total amount of respective proteins in the DRM fractions 4–6. *P<0.02, **P<0.008.