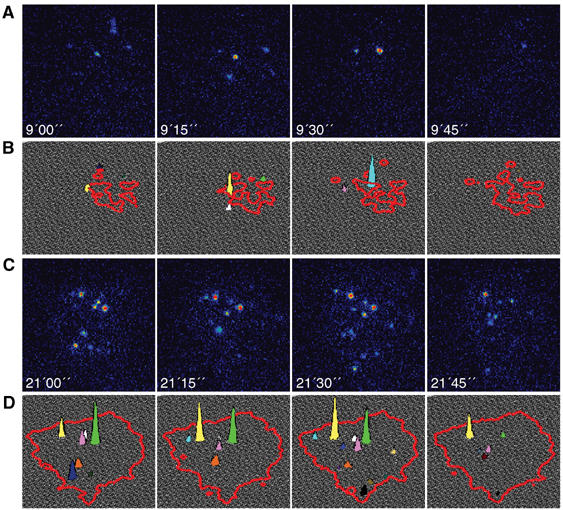
Figure 2.

Vertical movement of QDs. QDs moving more than 200 nm away from the glass surface exit the TIRF excitation range and disappear. Images were acquired every 15 s and the exposure time was 500 ms (under such conditions, QDs blinking probability is ∼1:10). (A, C) Four sequential frames from a TIRF movie; QDs are shown in intensity scale, where higher intensity is represented by warmer colors. (B, D) The fluctuations in QDs intensity are depicted using 3D graphs; the cell periphery is outlined in red and QD intensity by the colored peaks. During the first 10 min of adhesion QDs are very dynamic, as illustrated in four sequential frames from a movie (A and B). When the cell is spreading QDs are restrained, implying that the hyaluronan pericellular coat remains localized under the cells after spreading (C and D).
