
Figure 7.
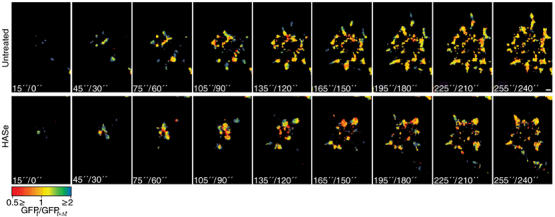
Temporal FRIT analysis of paxillin–GFP, in the presence or absence of pericellular hyaluronan. The dynamic behavior of paxillin–GFP in RCJ-P cells is shown here by the FRIT analysis of pairs of images taken in 15-s intervals, using TIRF microscopy. The spectrum scale indicates the value of the ratio in a range from 0.5 (red) to 2 (blue), with yellow indicating equal normalized intensities (FRIT=1). Thus blue indicates a new structure, red indicates a structure that has disappeared and yellow indicates structures that remained constant. (A) Untreated cells continuously form new structures during first 4 min of attachment (blue). On average, 4.63±1.17 new structures are formed every 30 s. (B) Hyaluronidase-treated cells form few structures at the center that rapidly disappear while new structures form at the periphery. Overall, 3.17±1.13 new structures are formed every 30 s, which is significantly lower than in untreated cells (P<0.0001). A total of five cells from each experiment were examined. Statistical analysis was based on Student's t-test. Scale bar=2 μm.