
Figure 4.
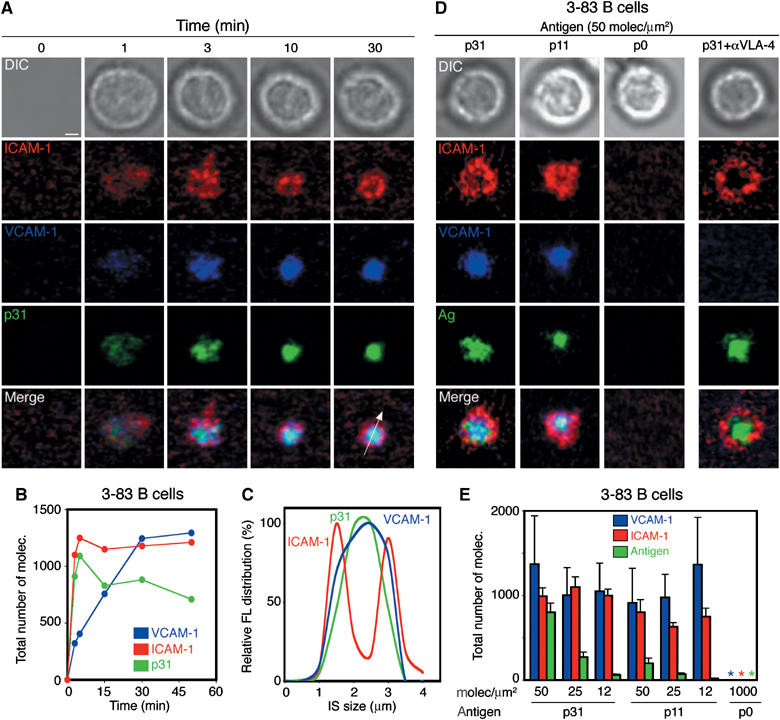
VLA-4 can drive the recruitment of GPI-VCAM-1 to the cSMAC of the IS. Naive 3-83 B cells were settled onto planar lipid bilayers containing GPI-linked ICAM-1 (red) at 50 molec/μm2, GPI-linked VCAM-1 (blue) at 25 molec/μm2 and p31 antigen (green) at 50 molec/μm2. (A) Time-lapse fluorescent images show the accumulation of p31 (green), ICAM-1 (red) and VCAM-1 (blue) in the pattern of a mature synapse at the specified time points. The top panels show DIC images at the same time points. (B) Quantification of the total number of molecules of VCAM-1, ICAM-1 and p31 antigen during synapse formation of a representative 3-83 B cell. (C) Distribution pattern of the antigen ICAM-1 and VCAM-1 fluorescent signal across a section of the IS, shown as a white arrow in (A), at 30 min. (D) Naive 3-83 B cells were settled onto membranes containing ICAM-1 (red), VCAM-1 (blue) (50 and 25 molec/μm2, respectively) and different antigens (green) at 50 molec/μm2: p31 (KA=6.5 × 10⁷ M−1), p11 (KA∼7 × 10⁶ M−1) and p0 (null). DIC, fluorescence and merged images from a representative B cell are shown. (E) Quantification of the number of molecules of VCAM-1, ICAM-1 and antigen recruited in the B-cell synapse shown in (D). Data represent the mean of 50 cells in each case. Scale bar, 1 μm.